How to Show Better Execution Plans in Azure Data Studio
Table of Contents
Azure Data Studio is starting to mature and some neat features are coming to the vscode-based (and now multidatabase and multiplatform) tool.
We got query plans in the app since some time, but to be frank they’re not very pretty and have some issues with dark themes:
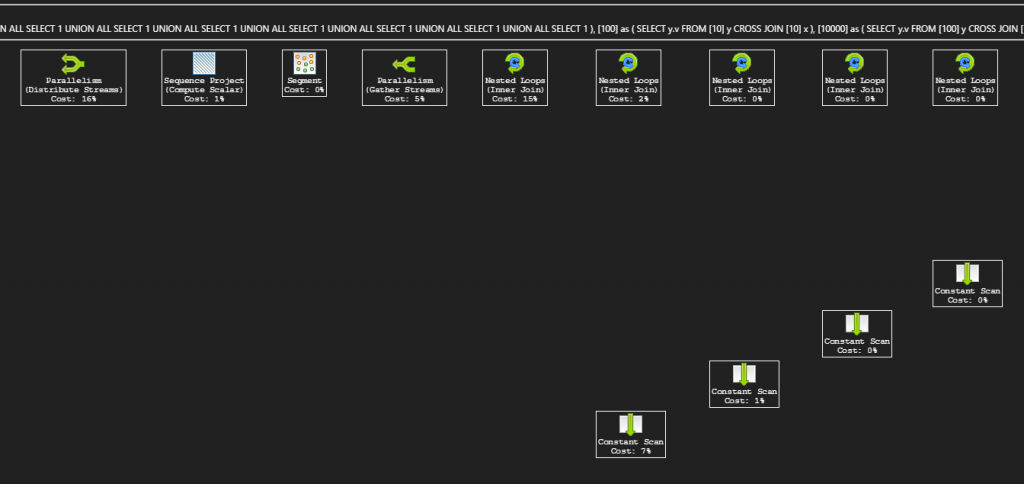
Phantom Lines in plans with Dark Theme
The new way
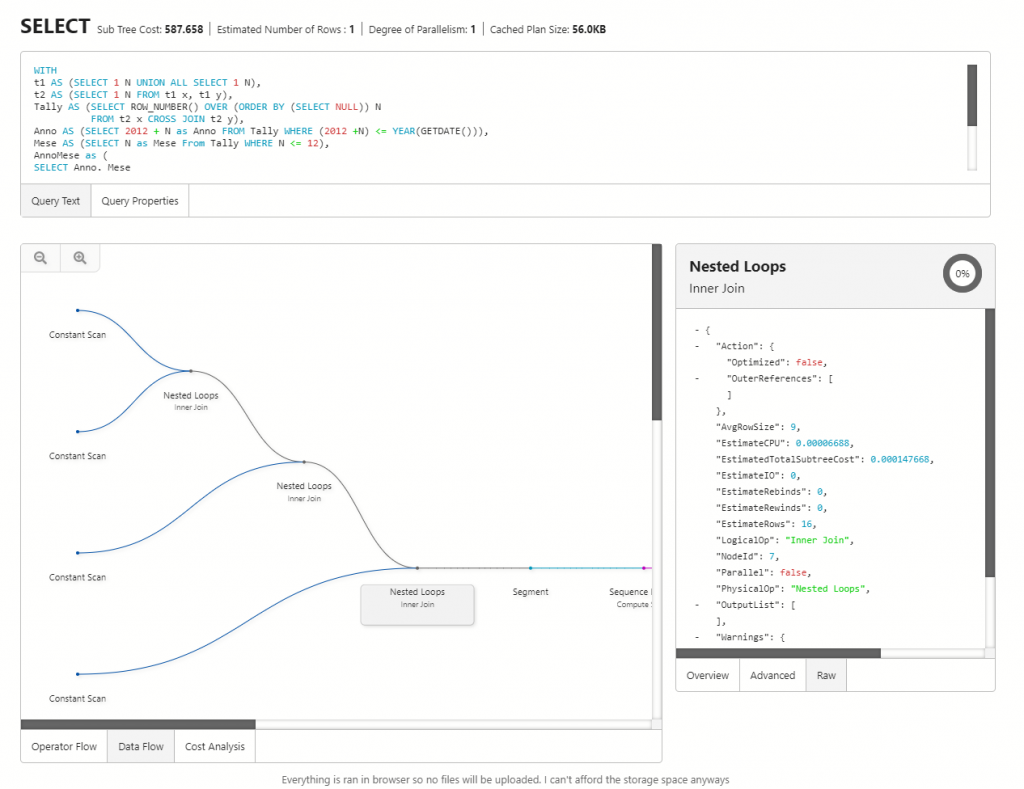
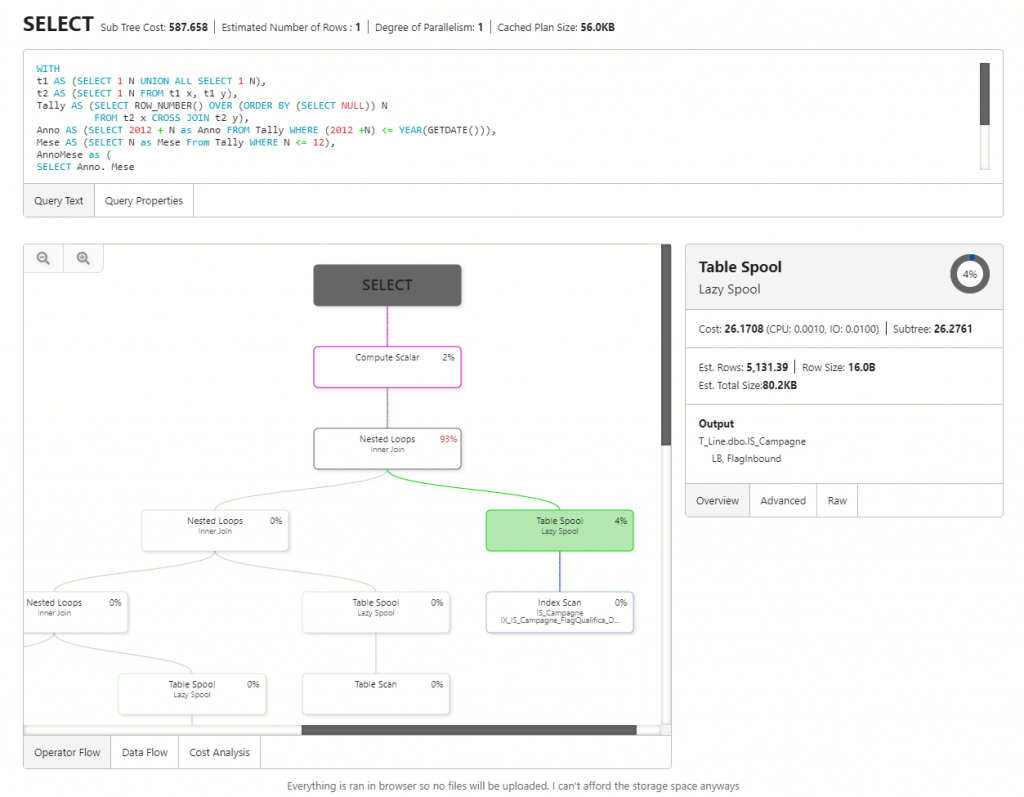
Phil Scott built the Queryplan.show extension for Azure Data Studio, which adds the in-app query plan analysis that’s on the website above.
Check it out:
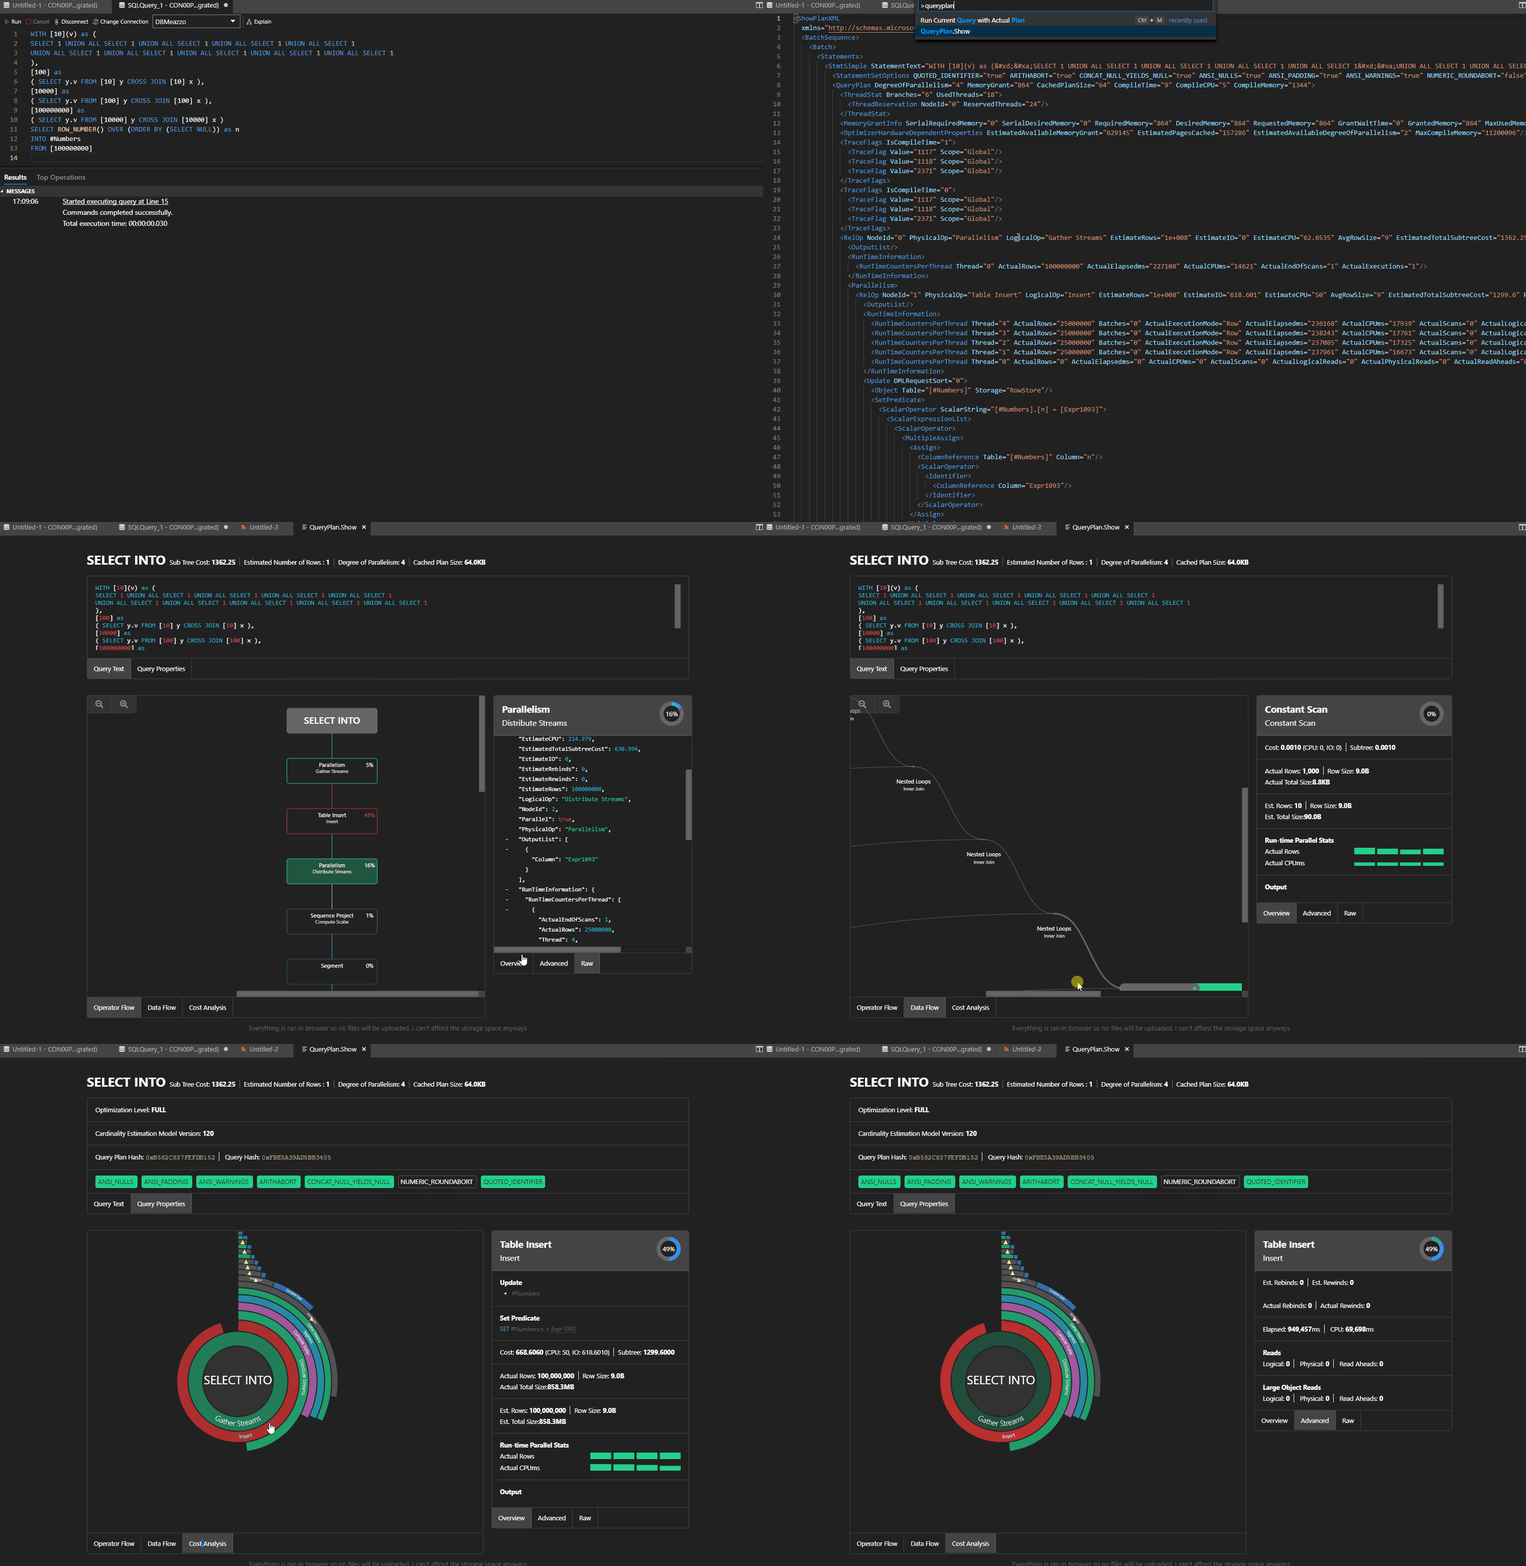
So Shiny
How to use it
- Download the latest vsix file from here
- Install it using “Install from VSIX” command (or file->Install Extensions from VSIX Package)
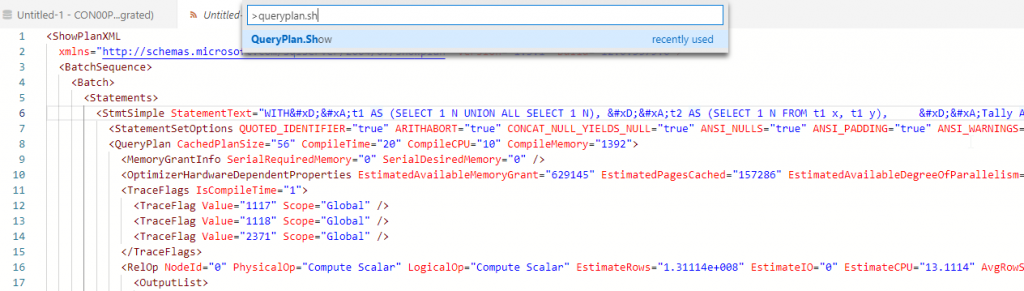
Then it’s pretty easy, you just have to find yourself with an XML Plan in Azure Data Studio, either by running your query with CTRL+M (as in the gif above) or for example getting it from WhoisActive or sp_BlitzCache and then launch the QueryPlan.Show in the command prompt (ctrl+shift+p)
And it looks good in every color theme!