Creating a Perfmon and Filestats reports in PowerBI [Part 2]
Table of Contents
In this previous post I detailed the structure of the objects to be created to create a live report in PowerBI to analyze Perfmon and Filestats data (which in my case was already being gathered but not used by the FirstRespondersKit tool); Let’s get to the PowerBI stuff.
Here is the final result that we’ll reach:
I’ll be starting from the existing FirstRespondersKit PowerBI template, but you can start from scratch too, same thing. I’ll not be going through the steps related to the graphs appearance (labels, titles, whatever) as anyone can personalize them as their heart desires. Note: if images seem small on your screen, you can right-click on them and select “Open in another tab” to view them in their majestic original resolution
Perfmon Report
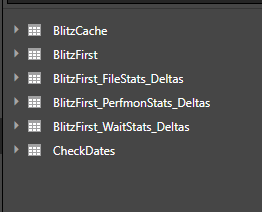
The model only actually contains this data:
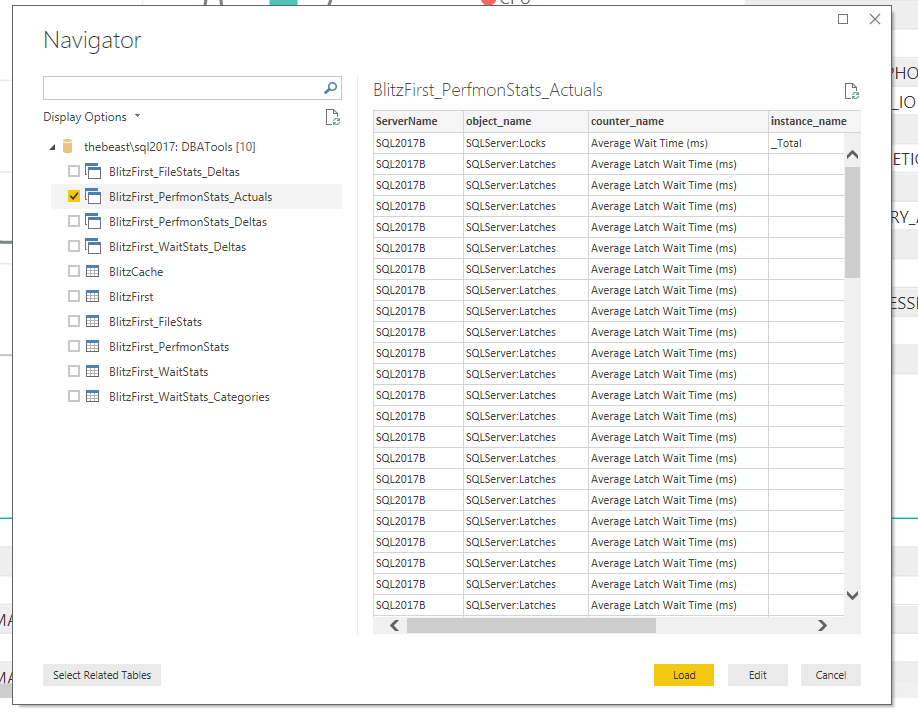
We need to import the data from the view created in Part 1 to use it for our perfmon graph, click on “Get Data”, insert the name of the instance and the database where the view is and select the view to import in the next screen:
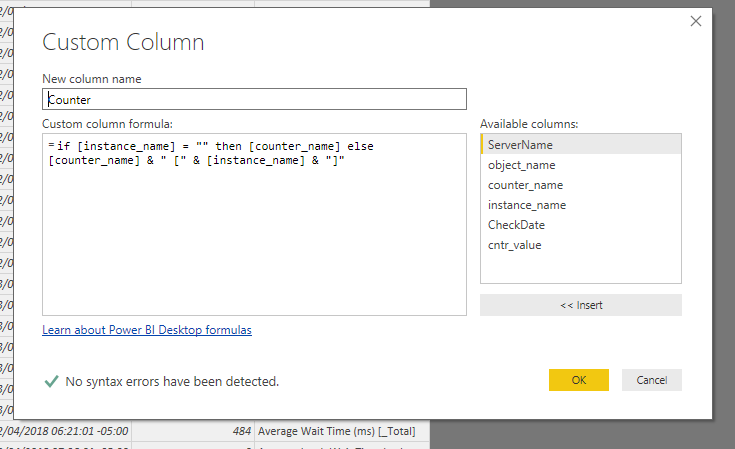
We need to make a small modification to the model for ease of use; Go to “Edit Queries”, select the query just added ad add a new column by selecting the “Add Column” tab and then “Custom Column”, this will open a new window to populate with this code:
if [instance_name] = "" then [counter_name] else [counter_name] & " [" & [instance_name] & "]"
Once that’s done, we’re ready to roll; Create a new report page and call it “Perfmon” or whichever funny name you wish. Next, create a line graph with these characteristics:
- Axis: CheckDate
- Legend: Counter
- Values: cntr_value
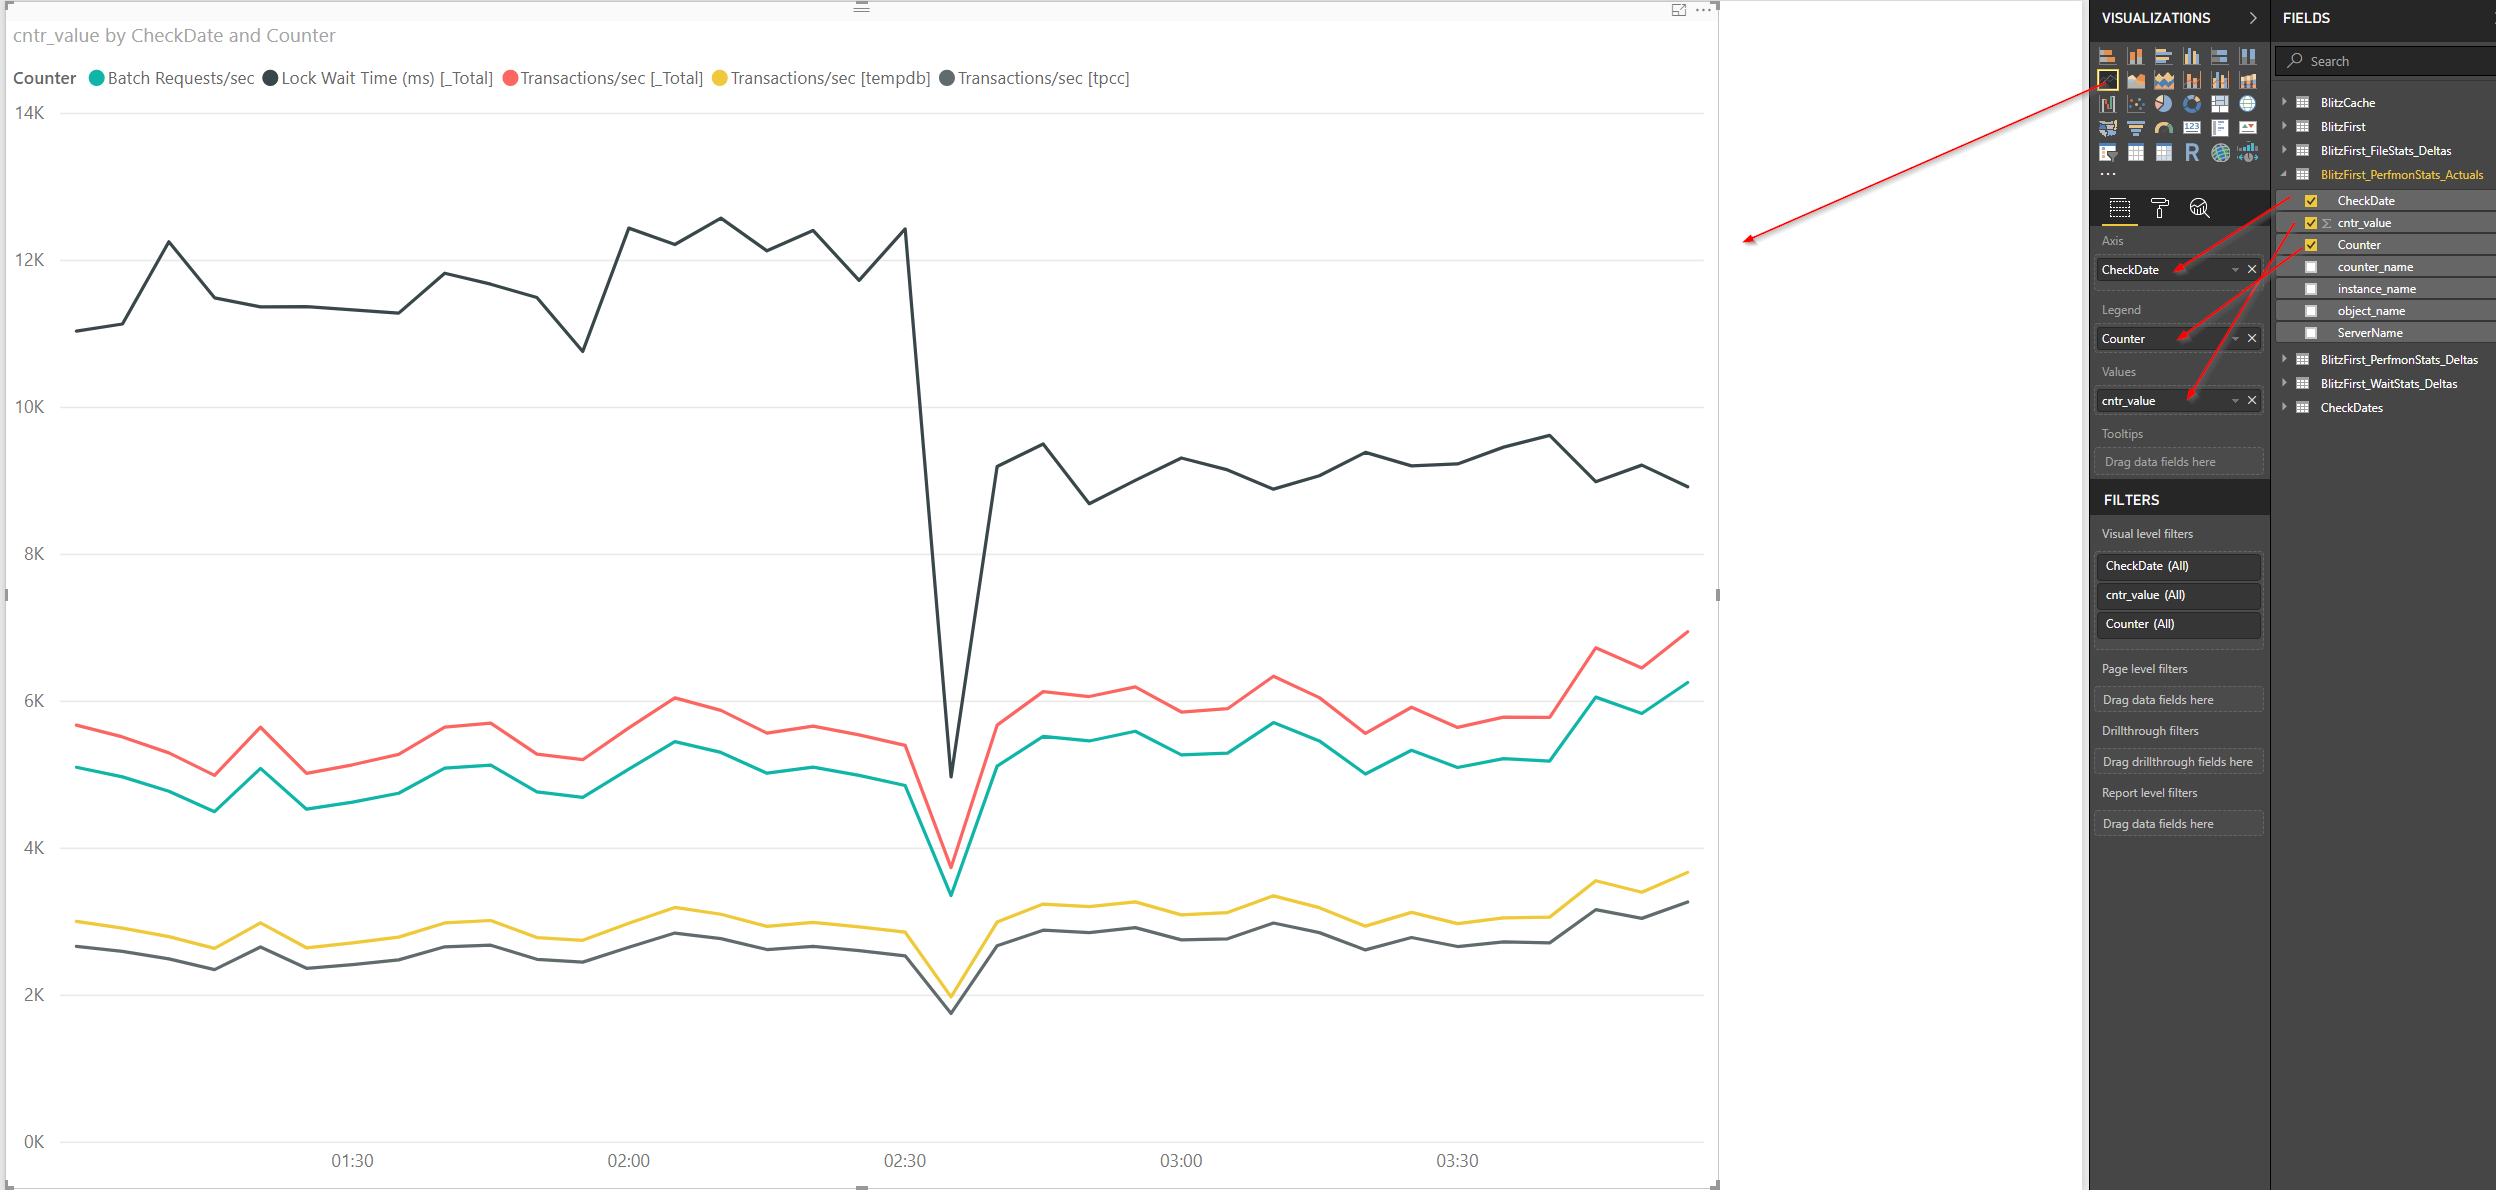
We are pretty much done as far as the graph goes, but we need to make it useful, starting with a filter to show the counter(s) that we actually want to see:
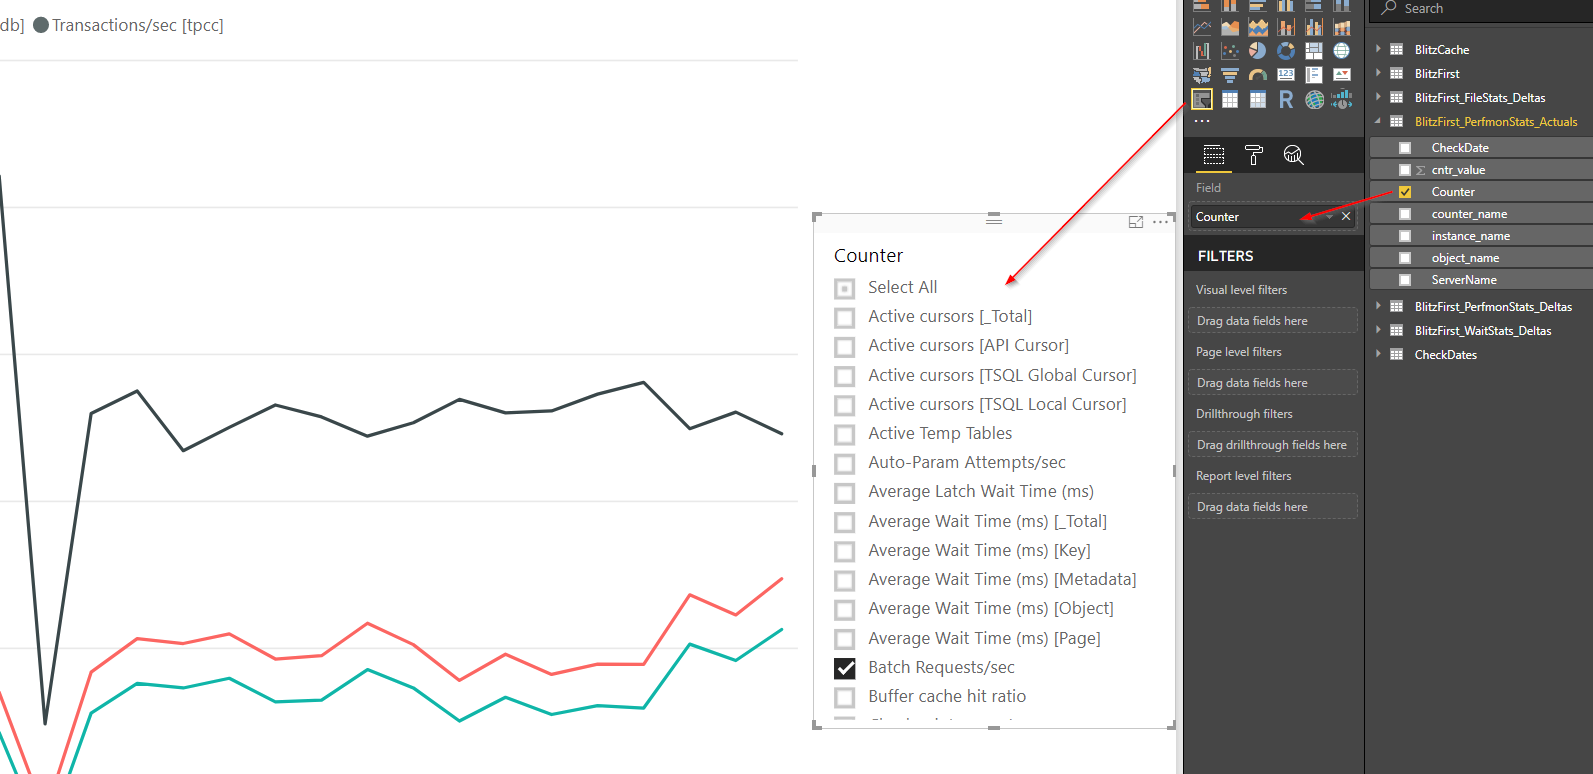
Be sure to have “Single Select” disabled in the format tab of the filter in order to be able to select more than one counter at the time. Next up, another filter for the server name, since in case we’ve gathered data for more than one instance, we don’t want that to mix up, don’t we?
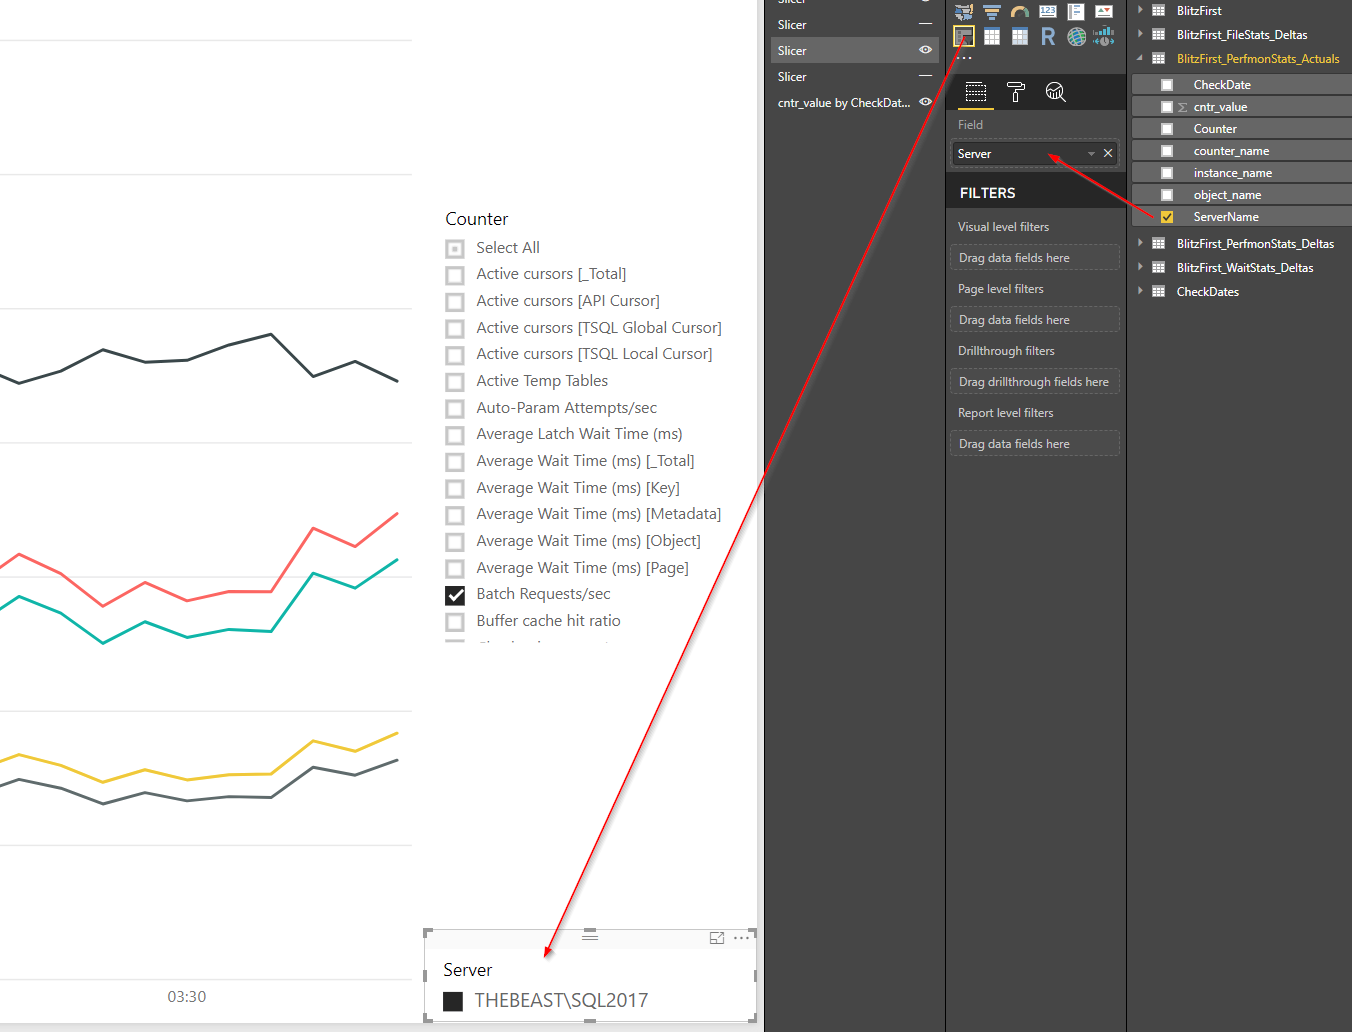
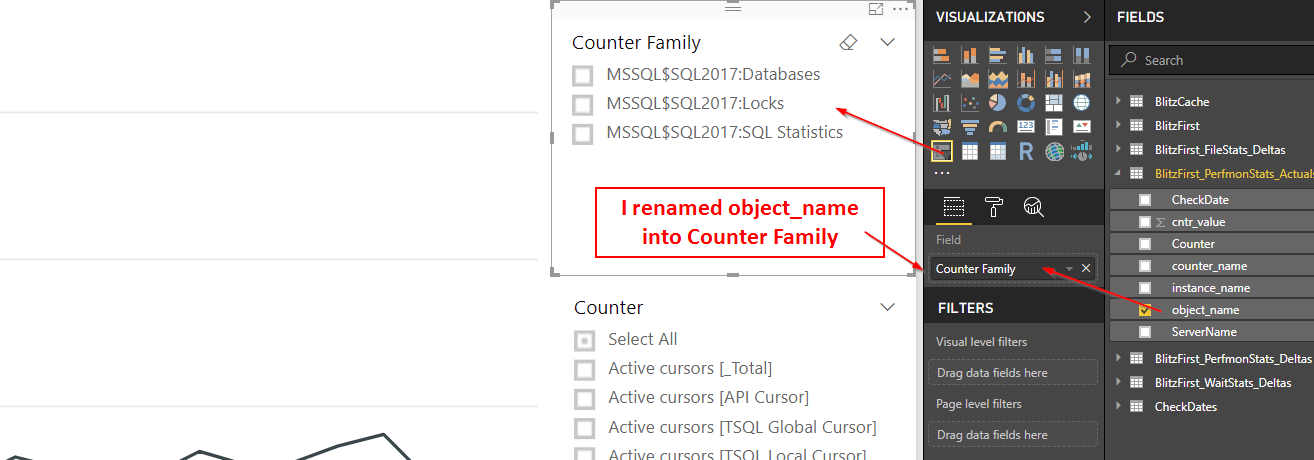
Next step, just for additional control (and being able to simultaneously filter the Counter List for quicker selection) I’m adding another filter on the Counter Family:
Finally, we can add two filters to narrow down the time slice that we’re analyzing:
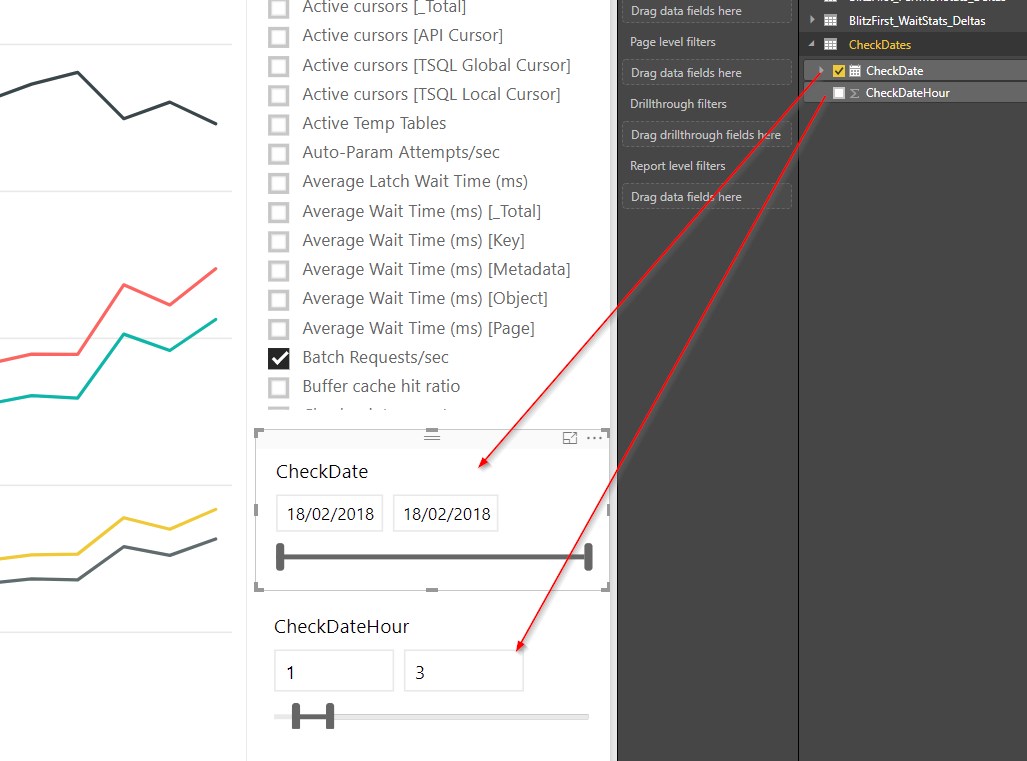
Be sure to enable the “Slider” toggle in the format tab of the Filters in order to have them like in the screenshot.
And that’s it, the whole PerfMon Page:
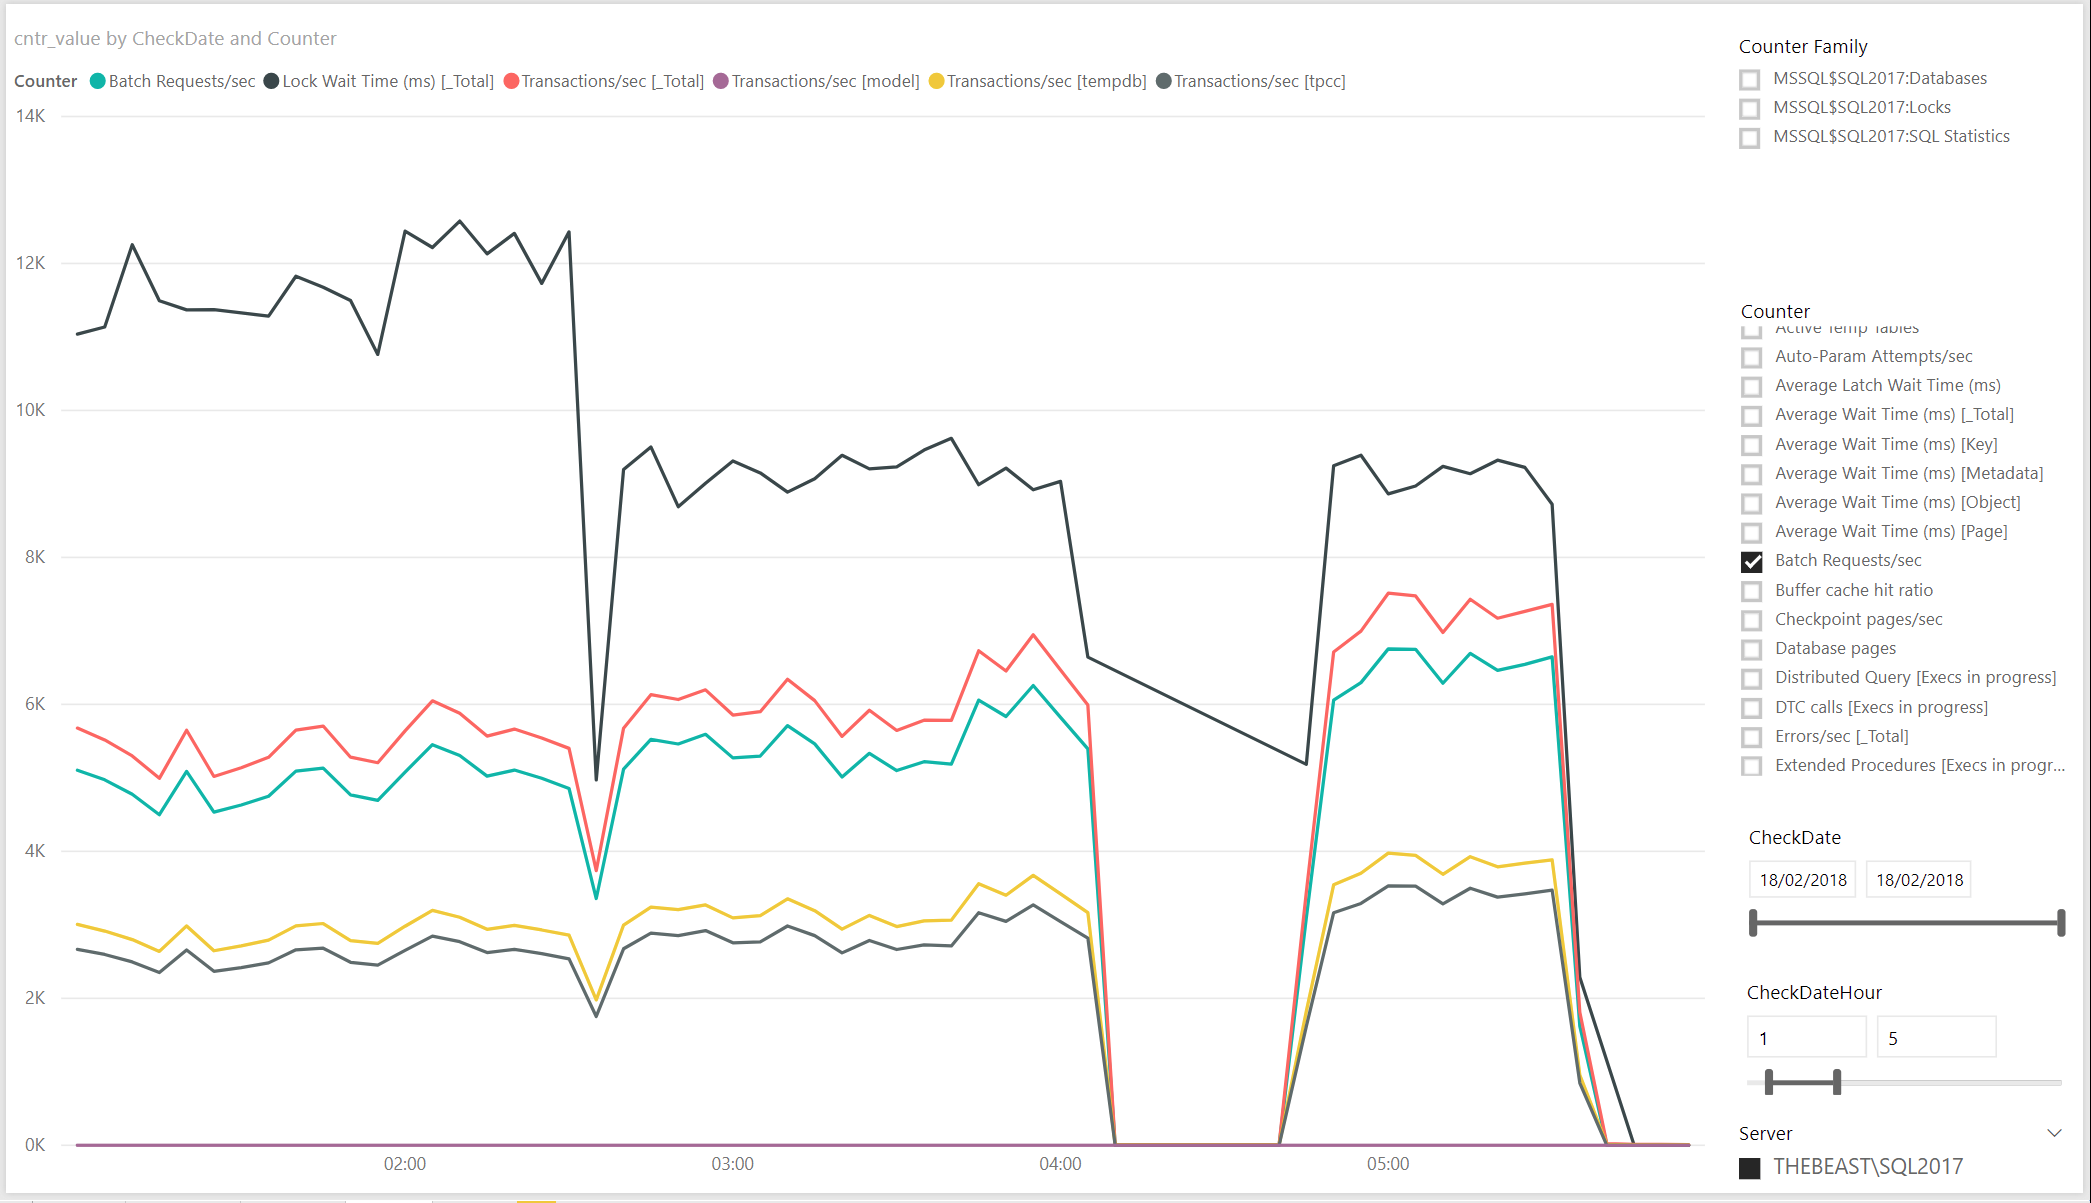
Filestats report
Let’s start by adding the filters this time, now you should already have a certain familiarity
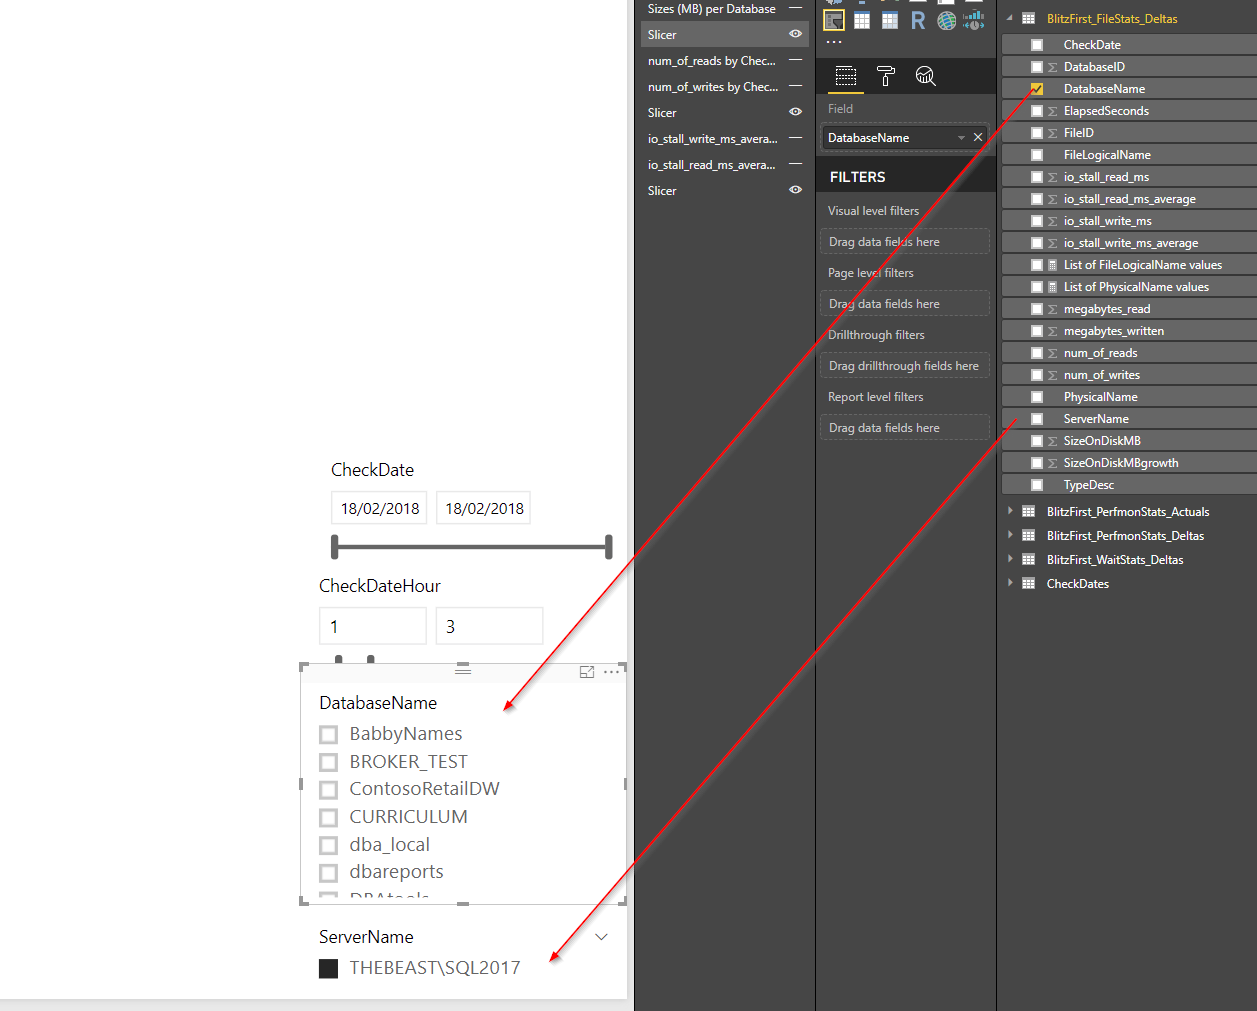
Now the serious part, let’s create a Line and Stacked Columns chart for the io read stall :
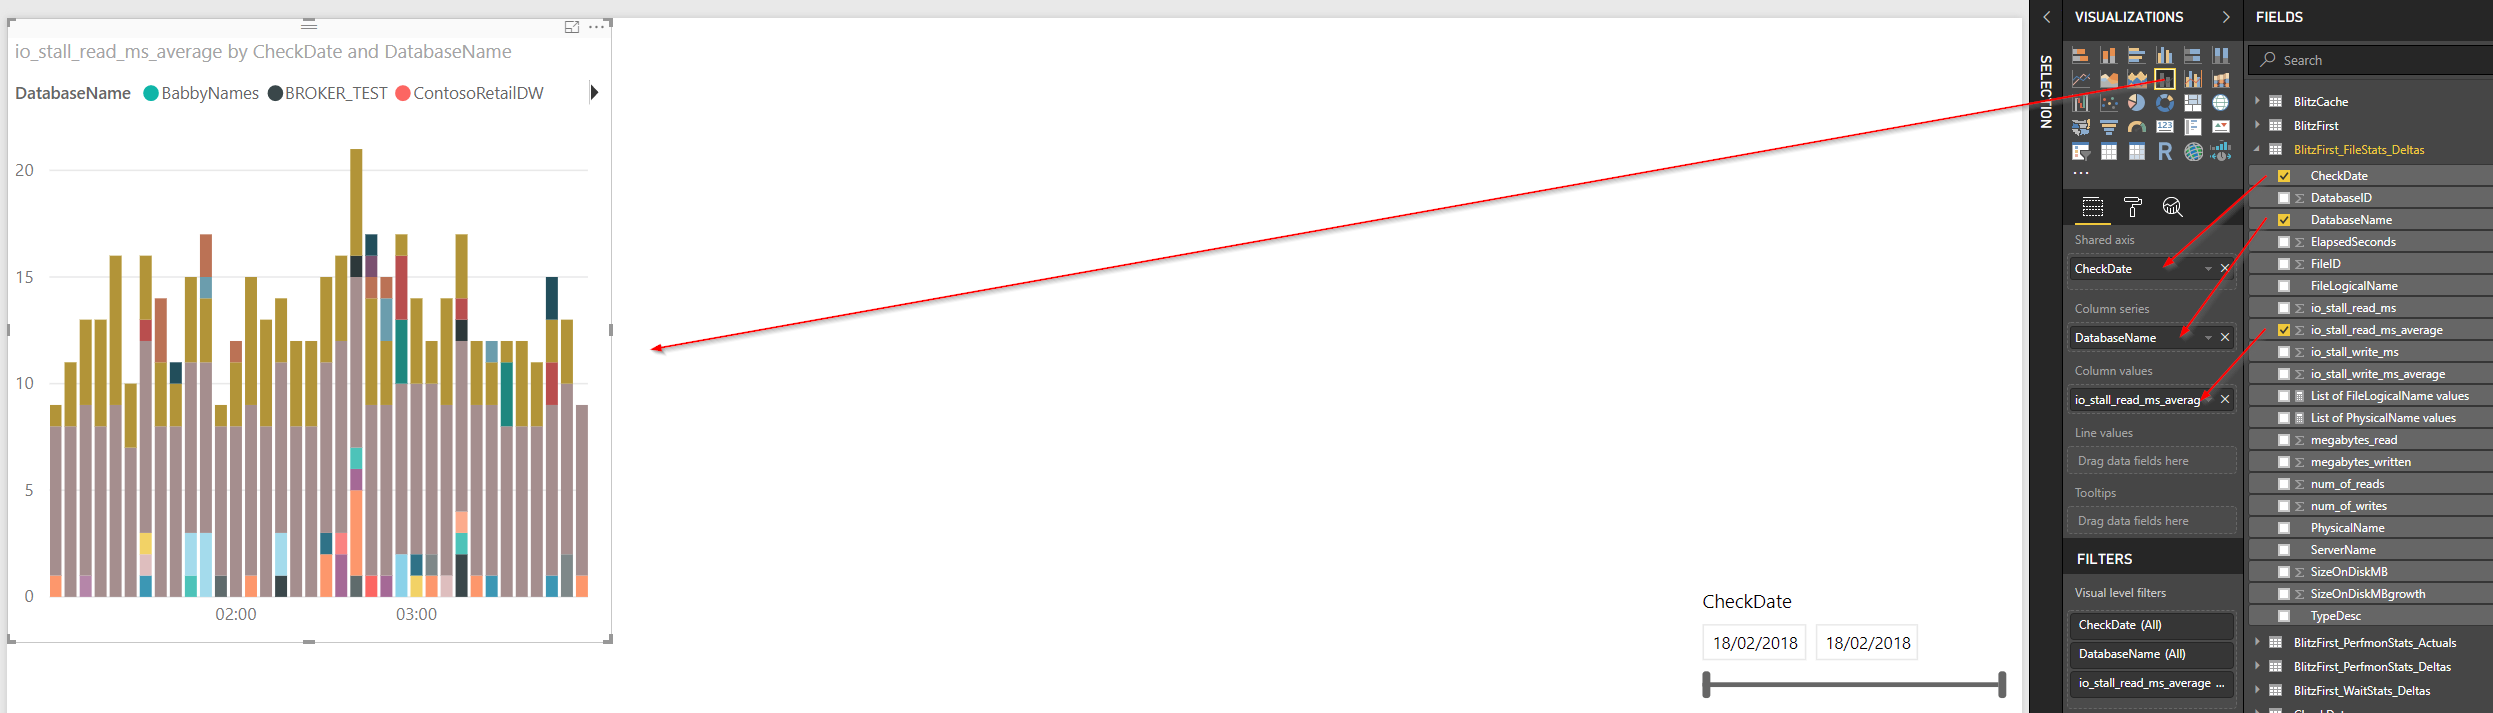
This graph will show the average reading stall, total and for each database in the timeframe. Depending on the configuration of your instance/database, the DatabaseName field could be switched out for the FileLogicalName in case your file resides on different volumes in order to identify which file is actually contributing to the stall time.
Let’s do the same exact thing for the write stall time, the same considerations as above apply:
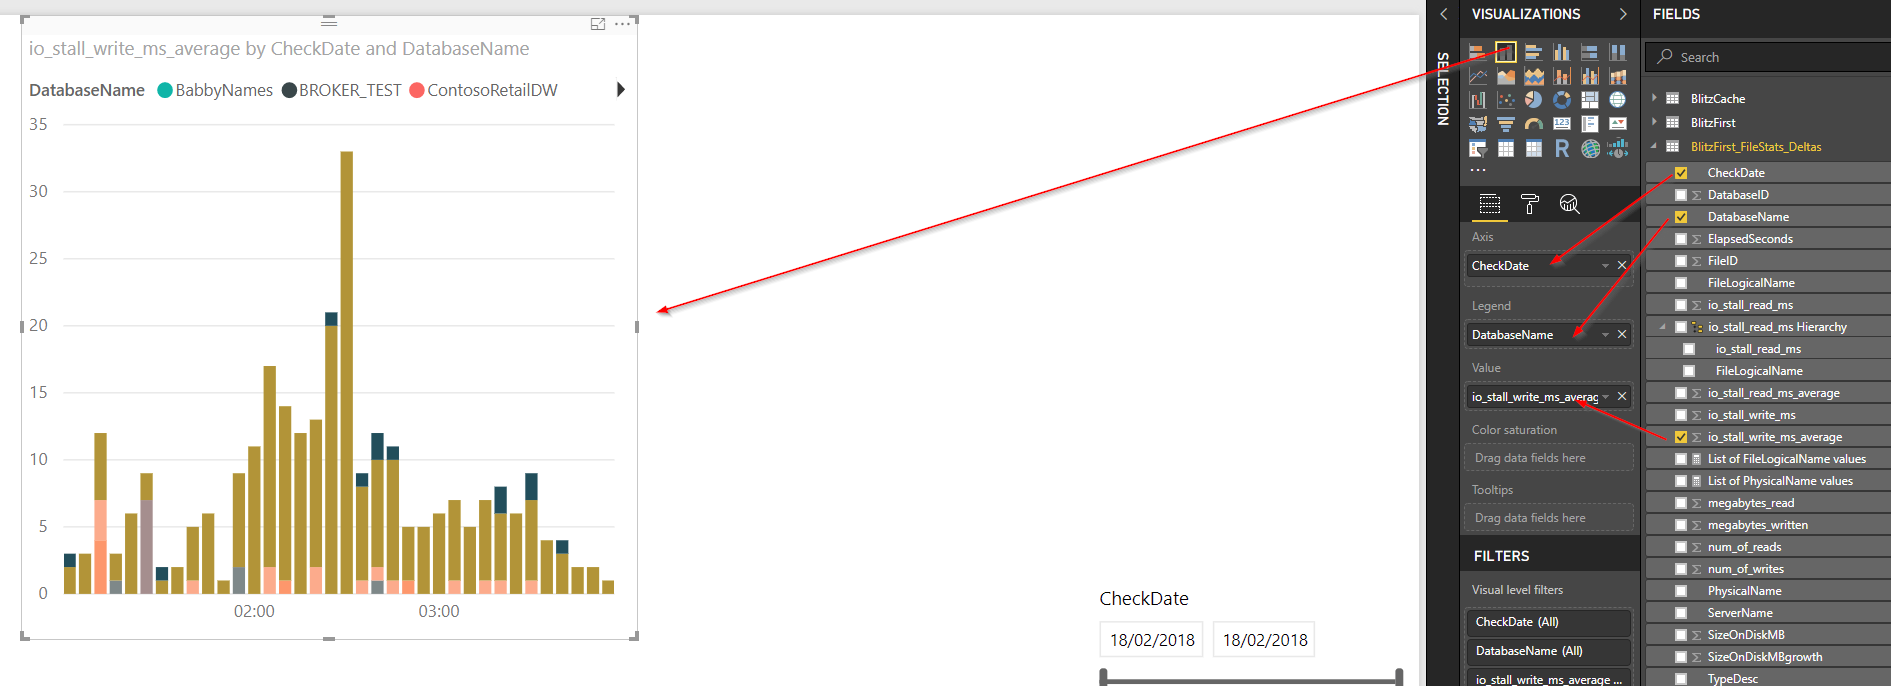
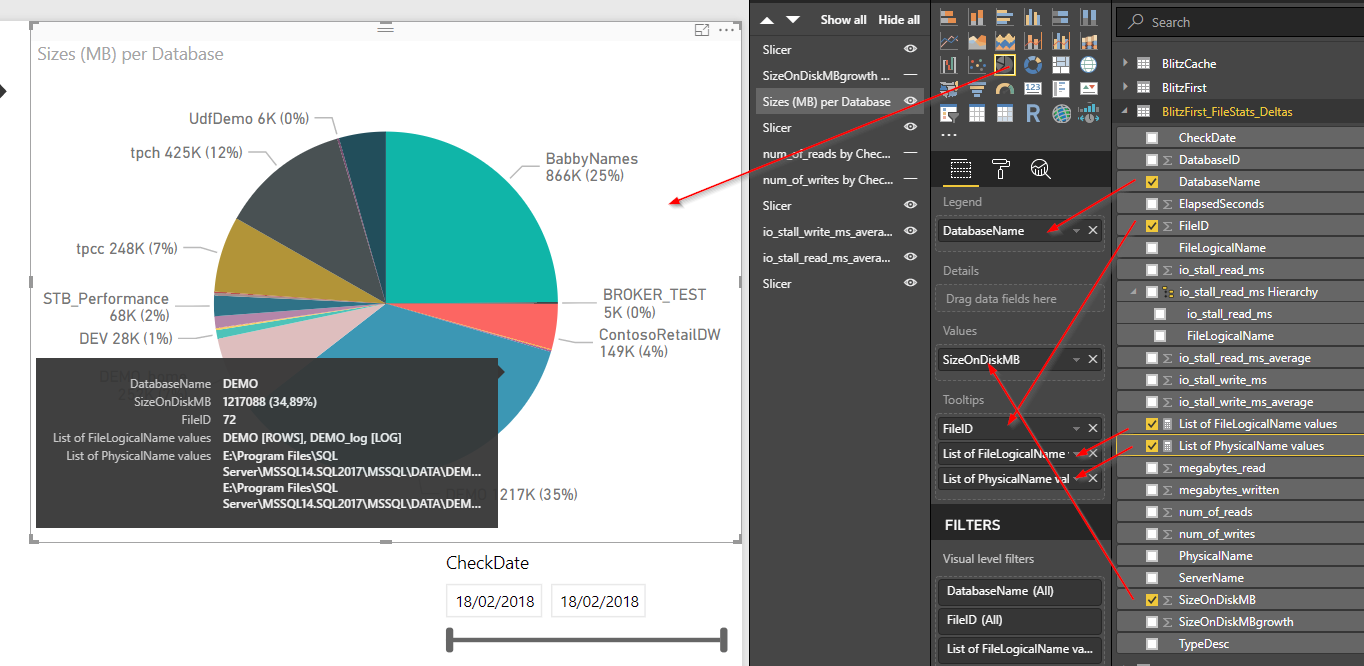
Up next, an overview of the total filesize for the databases; To do so, however, we need to create two measures to return more information in the tooltips Create a new measure by clicking on the 3 dots on the right of the FileStats field and use this as the measure definition:
List of FileLogicalName values =
VAR __DISTINCT_VALUES_COUNT = DISTINCTCOUNT('BlitzFirst_FileStats_Deltas'[FileLogicalName])
VAR __MAX_VALUES_TO_SHOW = 3
RETURN
  IF(
    __DISTINCT_VALUES_COUNT > __MAX_VALUES_TO_SHOW;
    CONCATENATE(
      CONCATENATEX(
        TOPN(
          __MAX_VALUES_TO_SHOW;
          VALUES('BlitzFirst_FileStats_Deltas'[FileLogicalName]);
          'BlitzFirst_FileStats_Deltas'[FileLogicalName];
          ASC
        );
        'BlitzFirst_FileStats_Deltas'[FileLogicalName];
        ", ";
        'BlitzFirst_FileStats_Deltas'[FileLogicalName];
        ASC
      );
      ", etc."
    );
    CONCATENATEX(
      VALUES('BlitzFirst_FileStats_Deltas'[FileLogicalName]);
      'BlitzFirst_FileStats_Deltas'[FileLogicalName];
      ", ";
      'BlitzFirst_FileStats_Deltas'[FileLogicalName];
      ASC
    )
  )
This will simply concatenate the File Logical Name for the database (max 3, feel free to change the parameter) in order to have a simple list of the files that are part of the DB. The same will be done for the Physical Filenames:
List of PhysicalName values =
VAR __DISTINCT_VALUES_COUNT = DISTINCTCOUNT('BlitzFirst_FileStats_Deltas'[PhysicalName])
VAR __MAX_VALUES_TO_SHOW = 3
RETURN
  IF(
    __DISTINCT_VALUES_COUNT > __MAX_VALUES_TO_SHOW;
    CONCATENATE(
      CONCATENATEX(
        TOPN(
          __MAX_VALUES_TO_SHOW;
          VALUES('BlitzFirst_FileStats_Deltas'[PhysicalName]);
          'BlitzFirst_FileStats_Deltas'[PhysicalName];
          ASC
        );
        'BlitzFirst_FileStats_Deltas'[PhysicalName];
        ", ";
        'BlitzFirst_FileStats_Deltas'[PhysicalName];
        ASC
      );
      ", etc."
    );
    CONCATENATEX(
      VALUES('BlitzFirst_FileStats_Deltas'[PhysicalName]);
      'BlitzFirst_FileStats_Deltas'[PhysicalName];
      ", ";
      'BlitzFirst_FileStats_Deltas'[PhysicalName];
      ASC
    )
  )
Now we can really create the Pie Chart with the overall File size and use the measures just created to relay more info in the tooltip
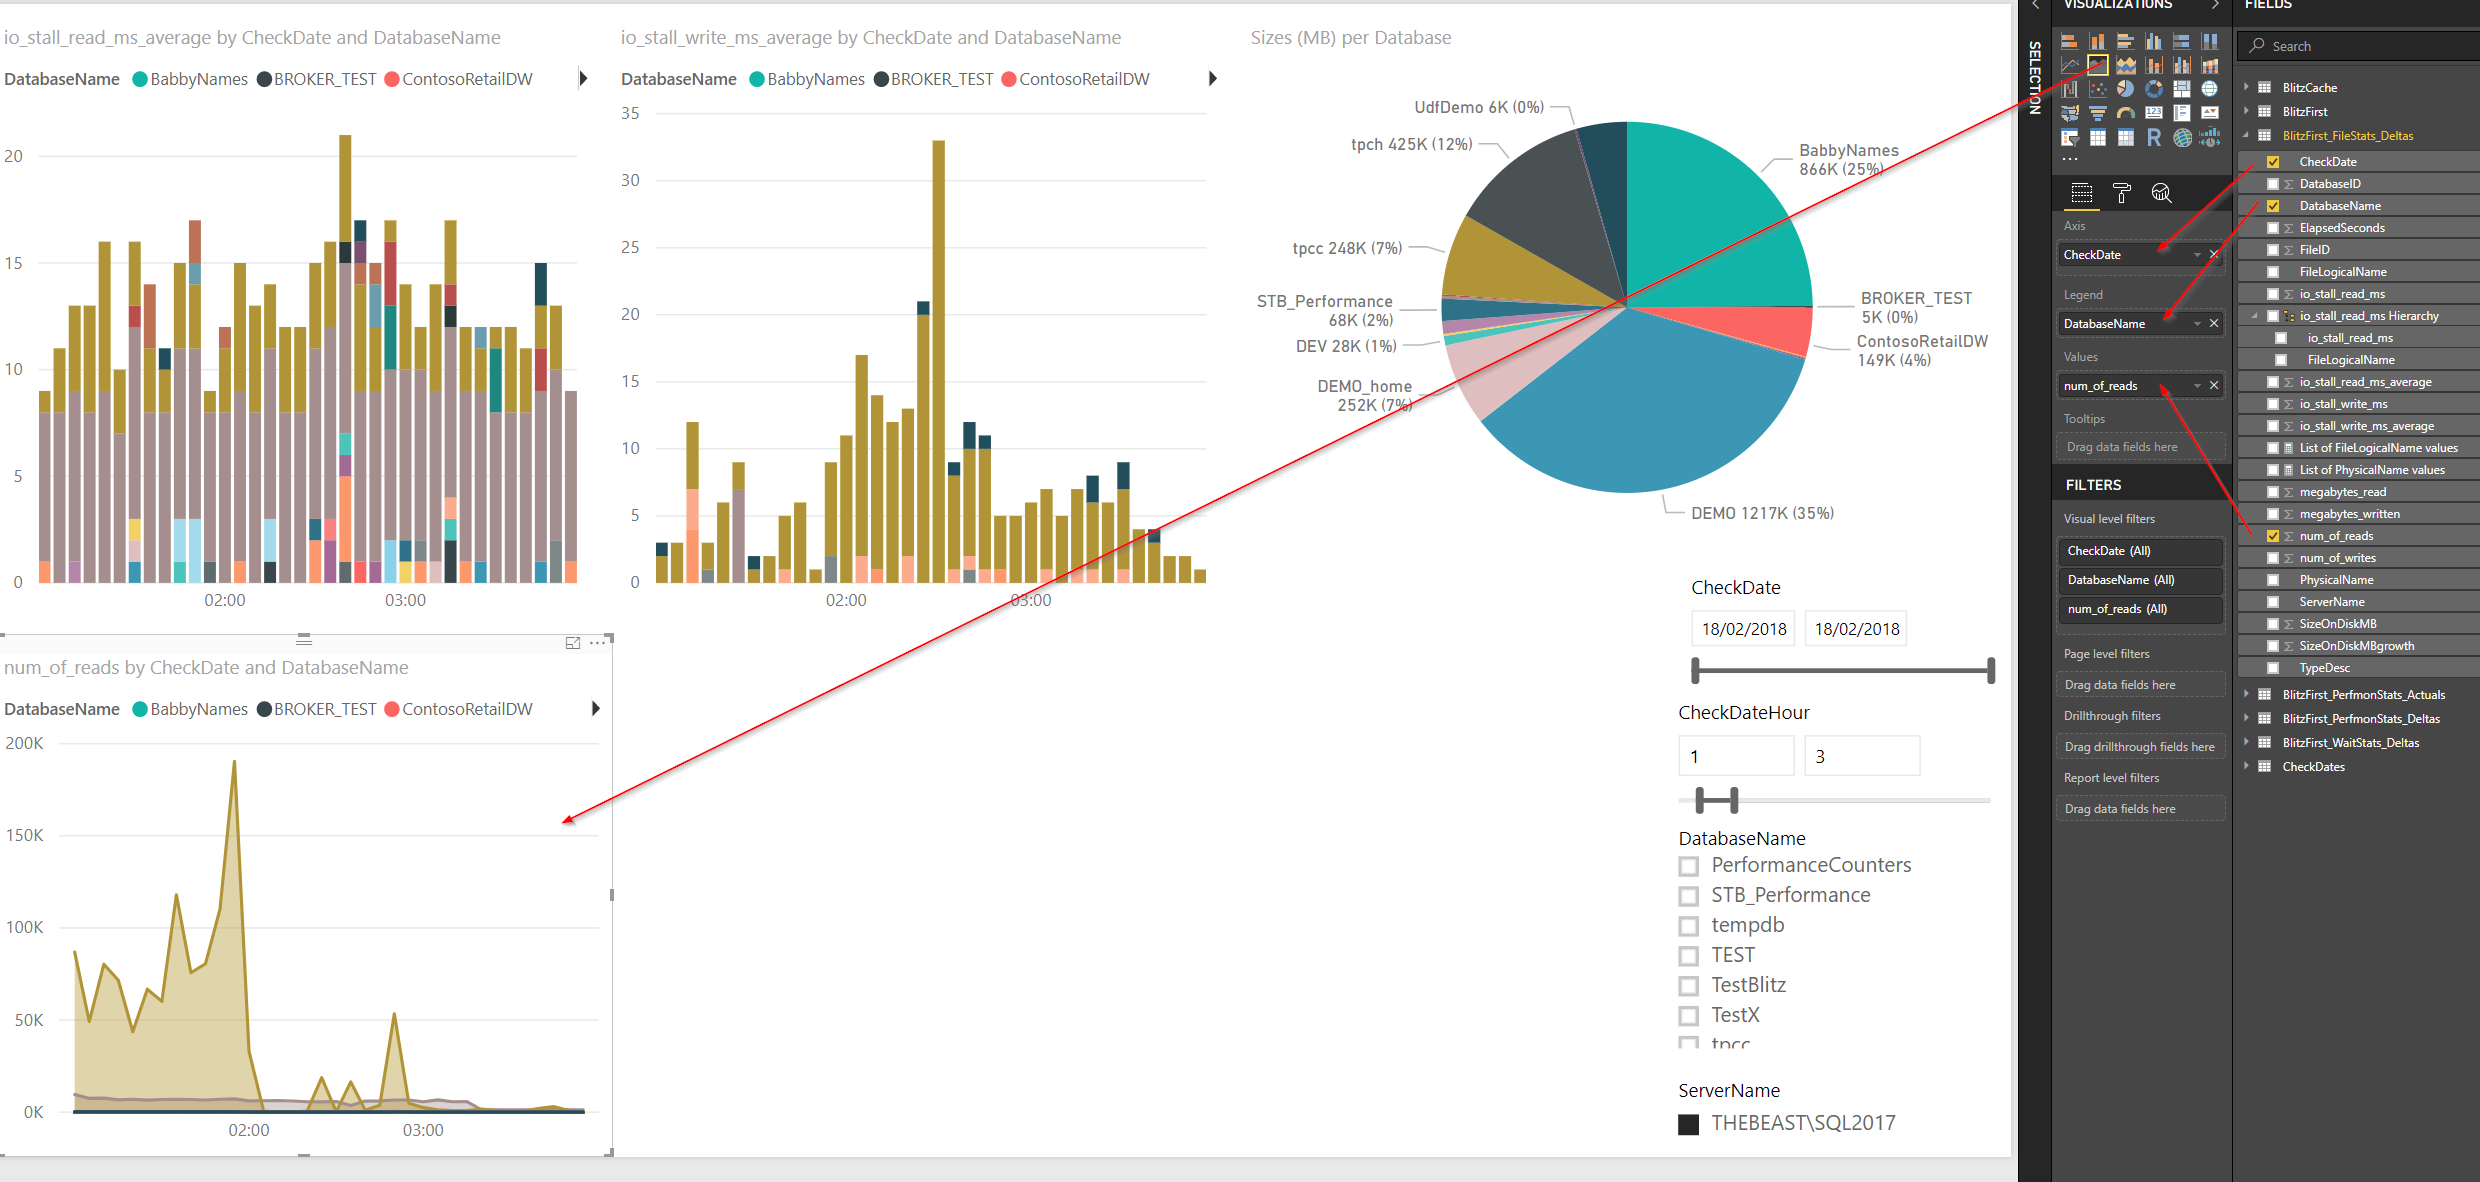
Now let’s create an area chart to highlight the number of reads performed on each database:
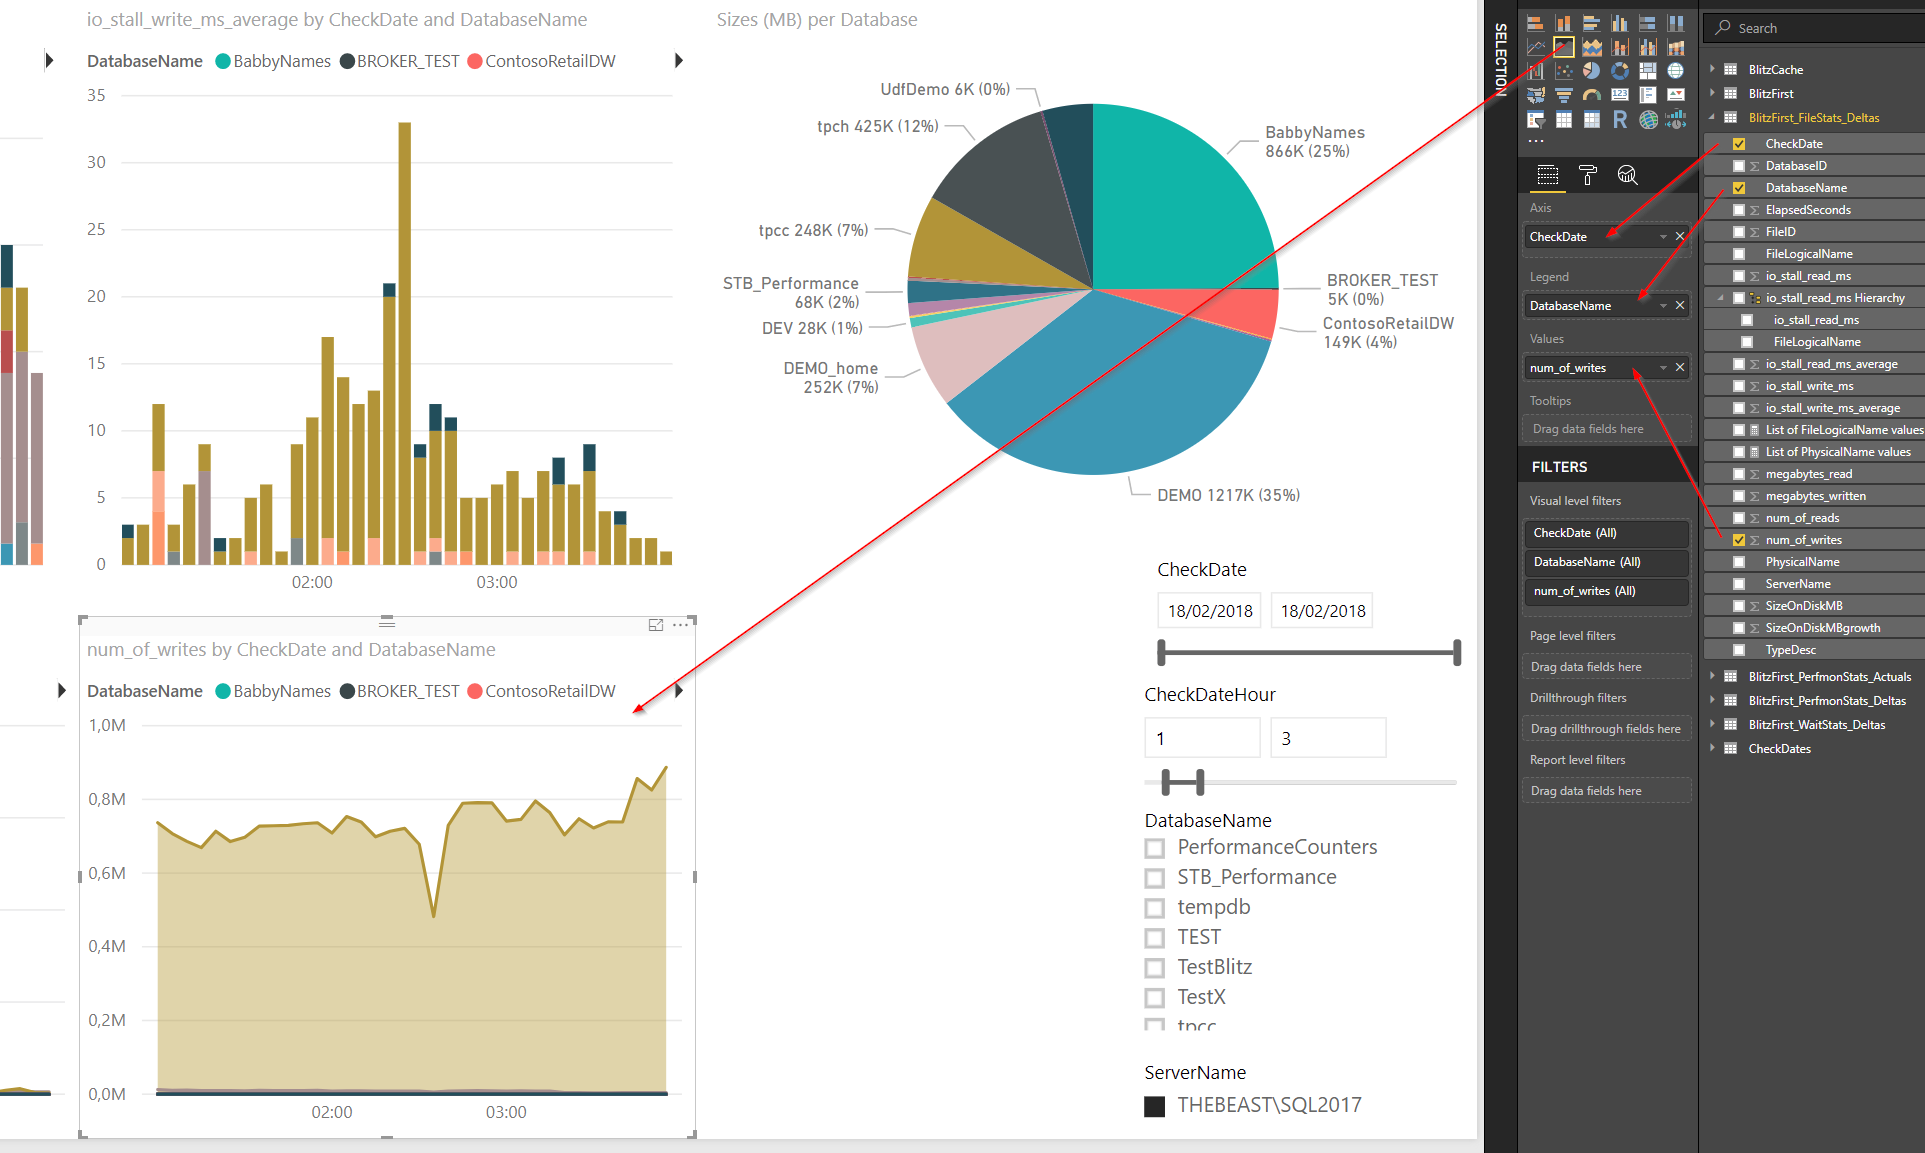
The same thing needs to be done for the number of writes:
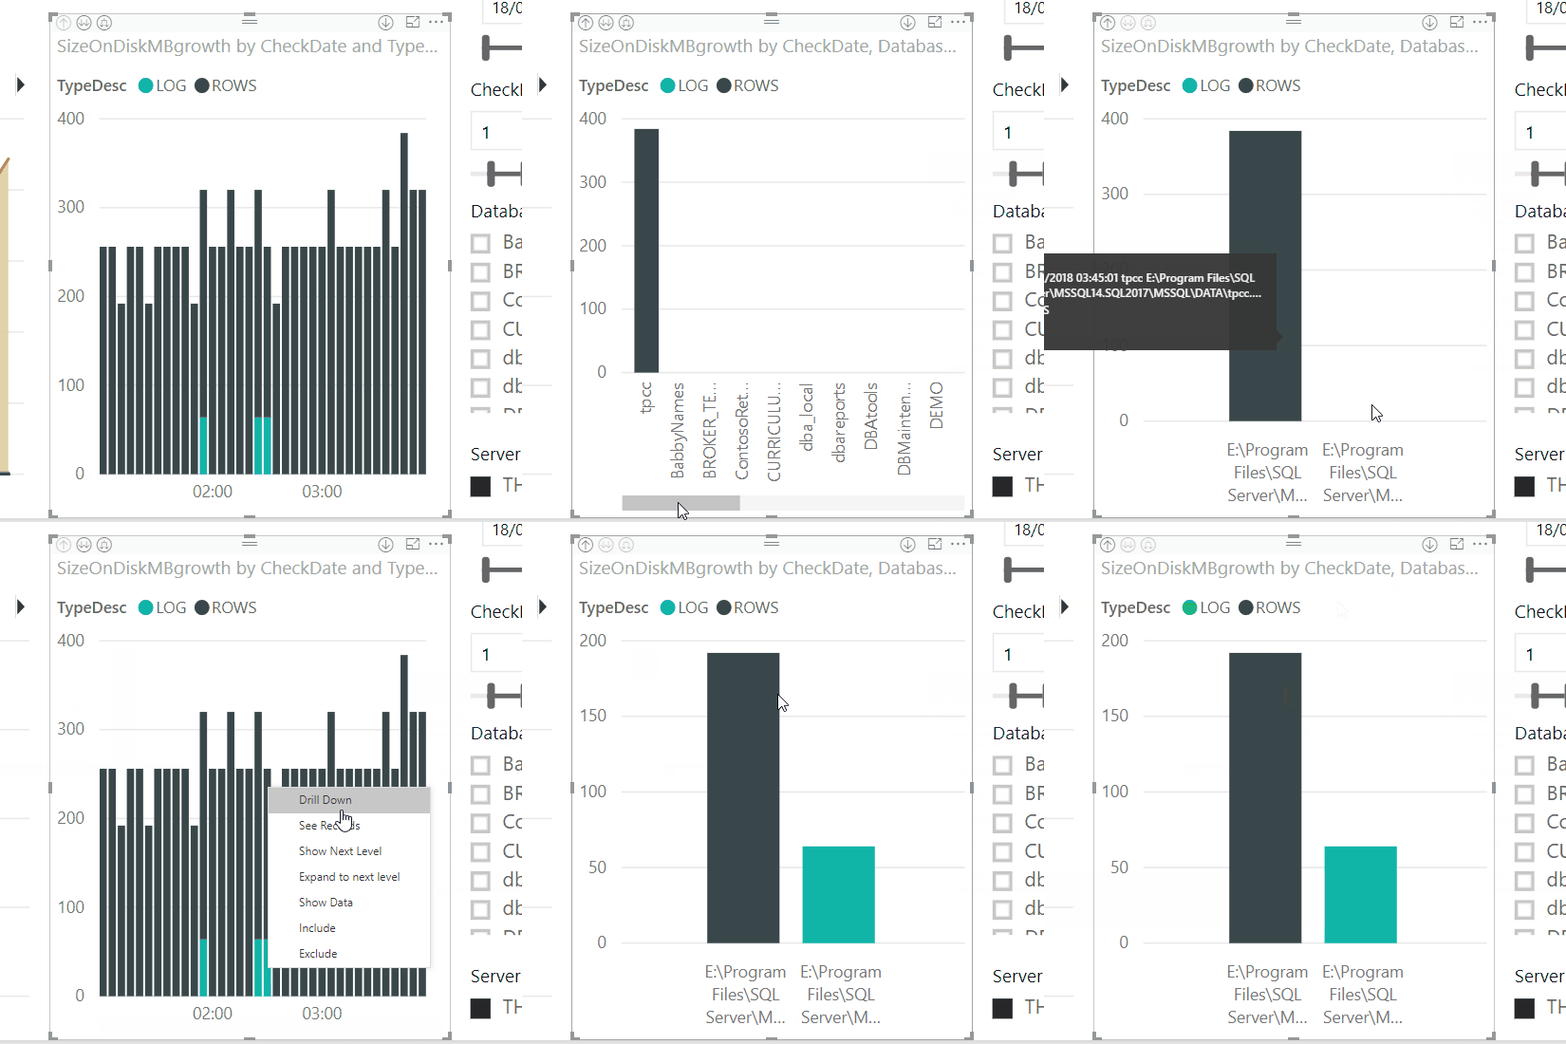
Finally, we’ll be adding a growth indicator for the files, which will be slightly more interesting, let’s start by adding the graph and the fields:
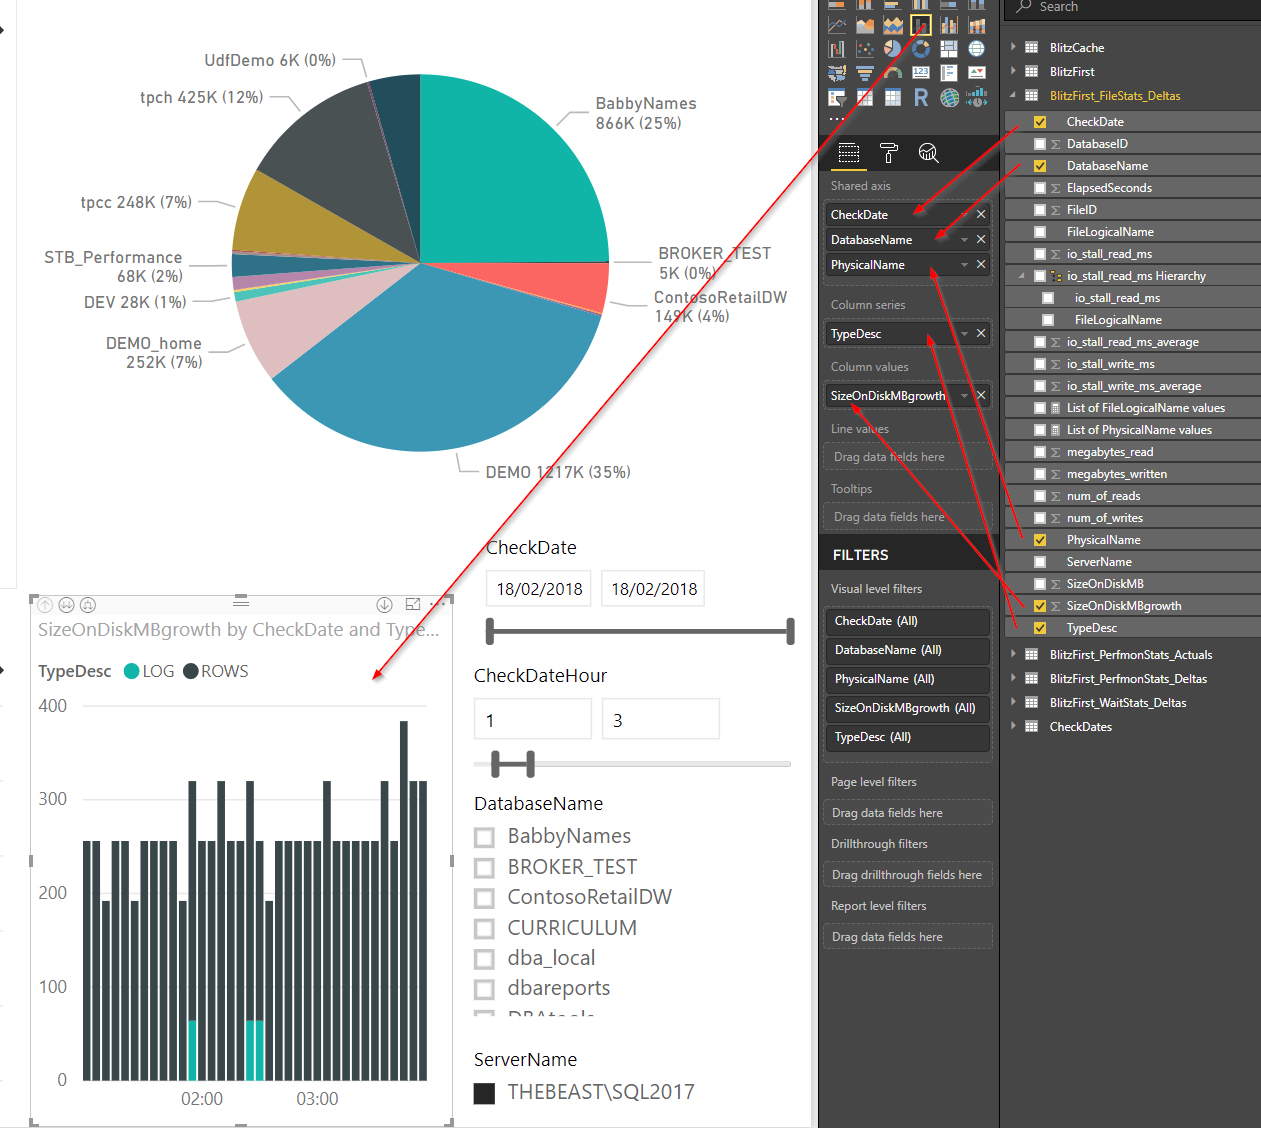
We’re adding multiple fields in the axis because we’ll be able to drill through to understand if the growth event was due to Log or Data file growth, to which Database was related and even to which Physical File .
Final words
That’s it, the fist version of this reporting tool. I expect many things to be upgraded in the future once that this version will be live and feedbacks will start coming in. That’s what I need you to do, send me feedback and complaints!
If anyone wants the PowerBI template as-is, just send me an email and I’ll forward it to you, no strings attached.